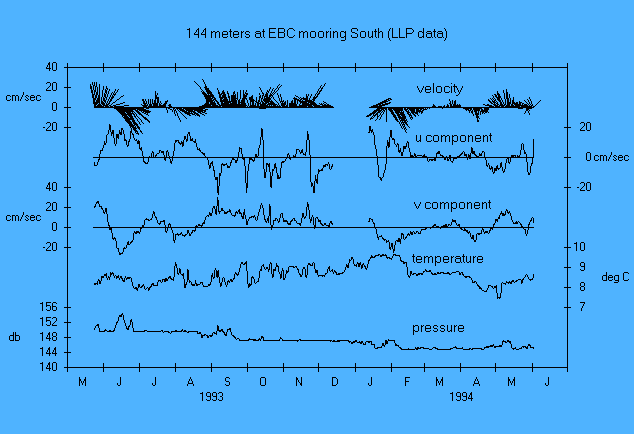
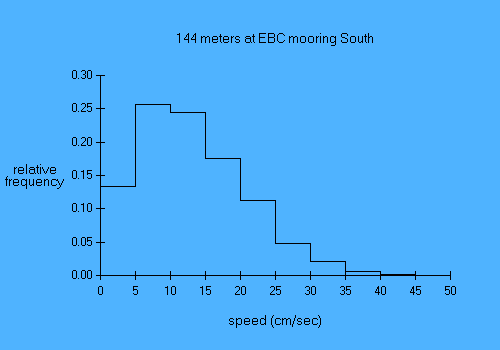
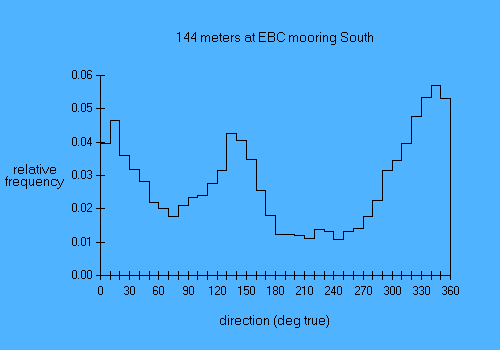
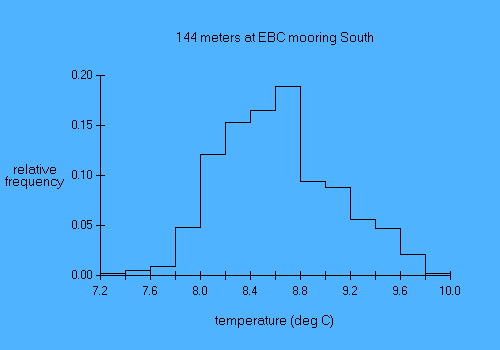
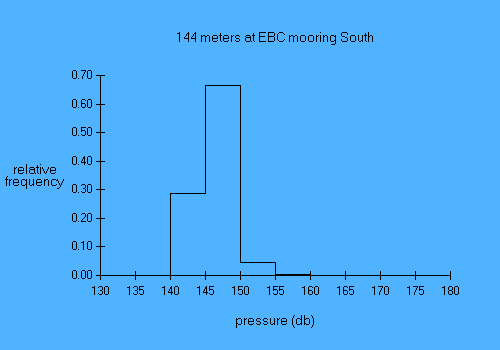
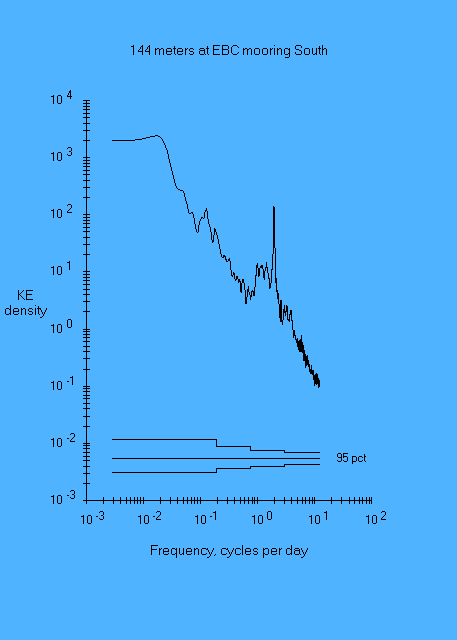
Scroll downward through this document to see time series plots, a progressive vector diagram, frequency histograms, and a KE spectrum from this current meter. The time series plots were made from filtered data (tides removed) and the remaining plots from unfiltered data.
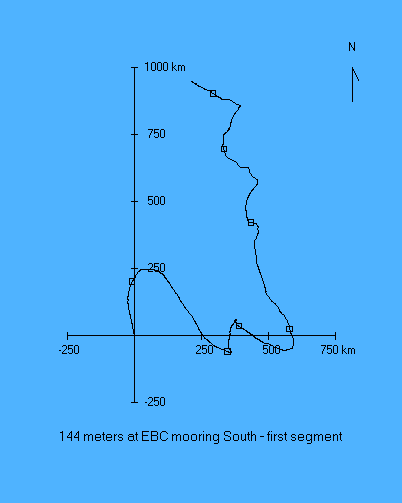
The axes of the PVD are labelled in kilometers. Boxes mark the beginning of each month. The current record contains a 25-day gap during December 1993 and January 1994; this plot shows the portion prior to the gap.
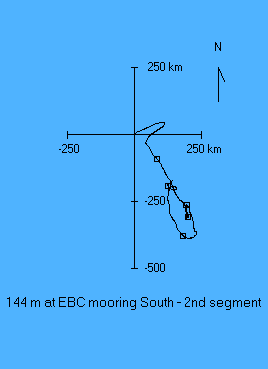
The axes of the PVD are labelled in kilometers. Boxes mark the beginning of each month. The current record contains a 25-day gap during December 1993 and January 1994; this plot shows the portion following the gap.
From here you can either return to the previous document or go back to the mooring array diagram to check out a different current meter.